INTRODUCTION
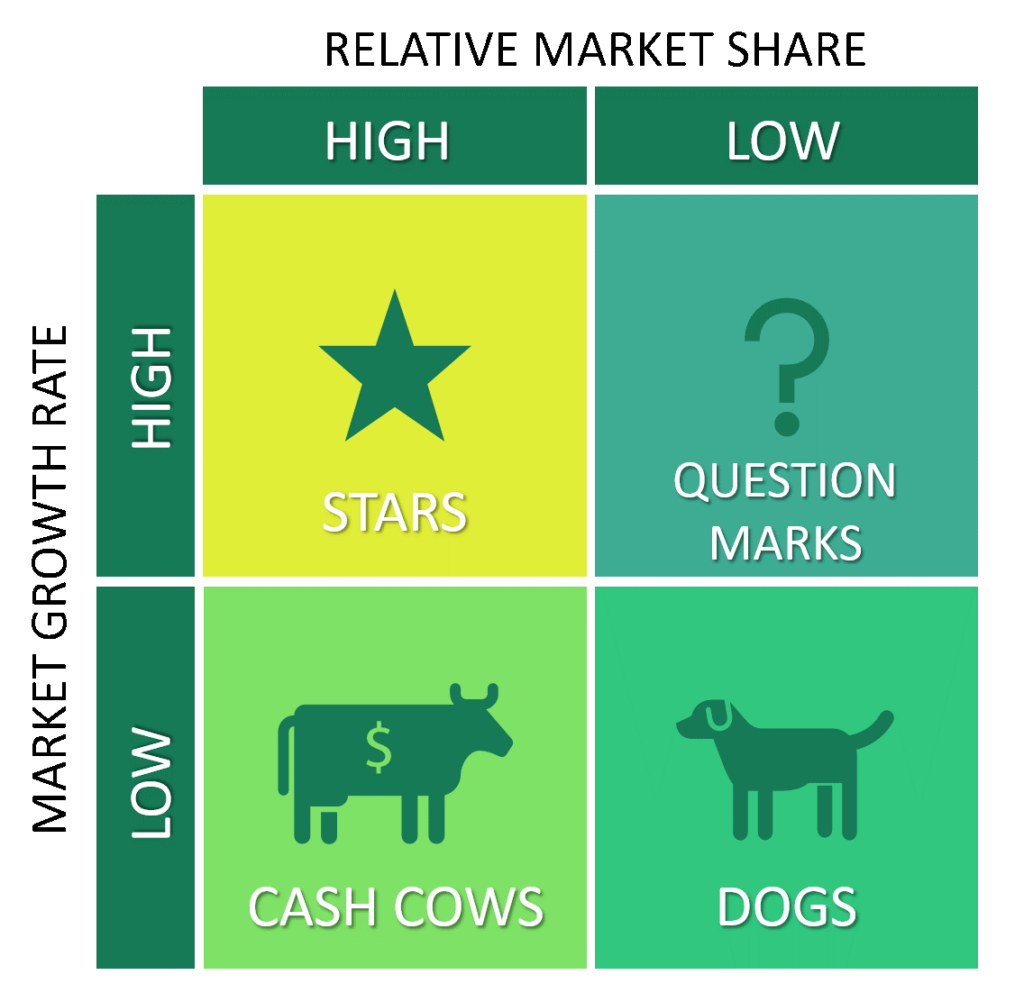
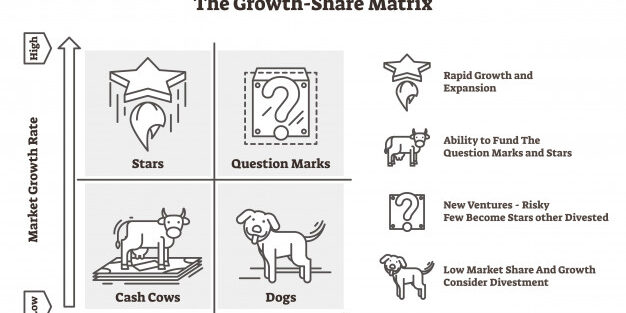
The Boston Consulting Group matrix is a strategic planning tool. It is also called a Growth/Share matrix. Bruce Henderson created the BCG matrix in the early 1970s. BCG matrix is a 2D matrix.
People often use the BCG matrix to determine where a business currently sits concerning other business regarding its market share and market growth. Where your business fall on the graph will make them:
- A star
- A dog
- A cash cow
- A question mark
HOW TO CONSTRUCT A BCG MATRIX?

The two axes are relative market share and market growth rate.
- Relative market share
Relative market share is the percentage of the market that the product serves.
Relative market share = your firm’s market share (or revenue) / Largest competitor’s market share (or revenue)
- Market growth rate
On the other hand, market growth is how fast that market is currently growing. It compares the business you have done in this year to the last year.
The graph helps to visualize various companies performances. Also, it offers a sound starting point for analysis.
Each quadrant has a different meaning.
- The dog quadrant
The business has a small share of a market. Also, it has a little growth. It follows the idiom – worked like a dog. It is difficult to argue for investing in something with a minimal growth rate.
- The cash cows quadrant
Cash cows are a much safer place for your business to be in than the dog quadrant. It has a large market share with small market growth. Usually, it means large returns for little investment. In other words, it means you can milk it for all it’s worth.
- The star quadrant
Stars are bright and shiny. They are on their way up. So, businesses on the star quadrant can attract investment. They are the market-leading products. Also, it can help to gain or maintain a dominant position in the space of enormous market growth. Businesses in this category generate a lot of income but require investment too.
- The question mark quadrant
These products do not have significant market share. So, they generate a little profit. But, unlike in the dog quadrant, they are in a high growth market. It means question marks could become cash cows or even stars with analysis and the right investment,.
USES OF A BCG MATRIX
- Reviewing a portfolio of products
If a company has different products or different product lines, then you can compare which product is performing better and which is not. Also, with a BCG matrix, you can know what to do to improve.
- Effective decision making
BCG matrix helps to make effective decisions. In business, you need to think while investing. So, the BCG matrix makes it easy to make decisions about investing in a product or divesting from a product.
- Allocation of resources
BCG matrix allows the best possible utilization of resources. It makes the work efficient. Also, it reduces the cost.
LIMITATIONS OF A BCG MATRIX
- It classifies businesses as low and high only. But, a business can be a medium too. So, it may not reflect the true nature of the company.
- The market is not clearly defined in the BCG matrix.
- According to the BCG matrix, high market share results in huge profits. But it is not always true. There are high costs involved with high market share.
- The BCG matrix only talks about the growth rate and relative market share. But there are other indicators of profitability too. So, the BCG matrix ignores and overlooks other indicators of profitability.
- At times, dogs may help other businesses in gaining a competitive advantage. They can earn even more than cash cows sometimes.


